Lesson #4 - Aqua
Aqua levels, similar to Violet levels, are retrieved every hour, although their characteristics are quite different. Violet levels, for reference, typically hold one level throughout most of the day, then shift to a new level in the evening after the Flow Zone (FZ). In contrast, Aqua levels usually appear near the current price level.
We have several models for trading Aqua levels:

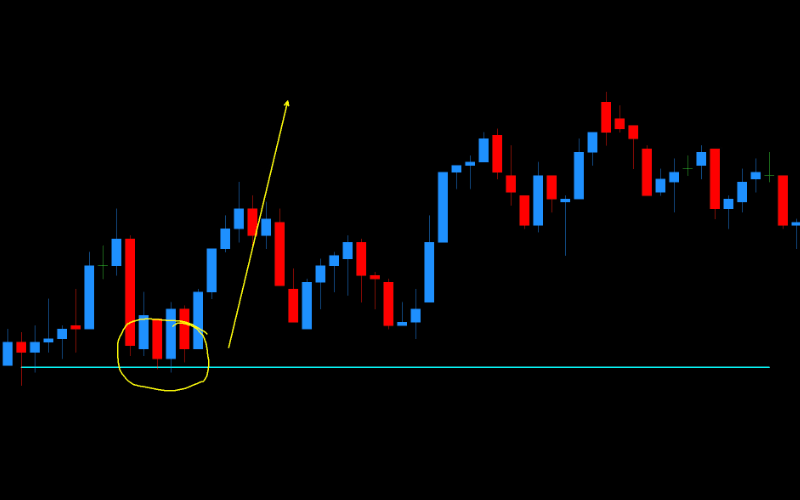
Reaction to Aqua Level During Its Duration
If the price reaches the Aqua level during its duration, we expect a reaction around 5 pips.
If the level is breached, and the reaction strategy fails, we expect the price to retest this level in the future.
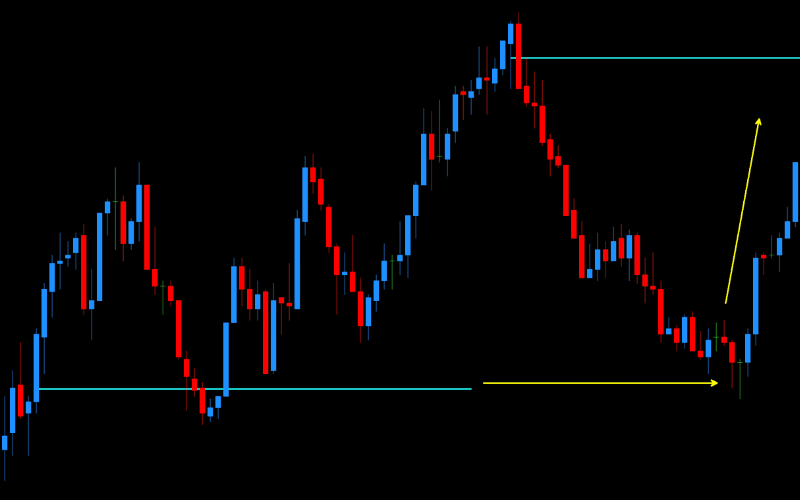
Reaction to Aqua Level After Its Duration
In a strong trend, these levels often do not get retested. This is an important "future" signal, as during a price correction, there is a strong tendency for Aqua levels to cause reactions after their duration has ended. Similarly, if such a level does not react initially, we expect it to be tested later.


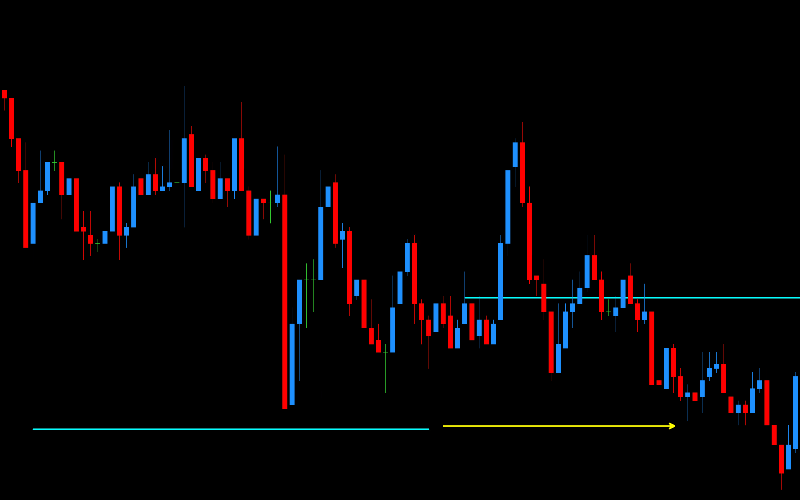
Approaching a "Floating" Aqua
Sometimes, the Aqua level does not intersect with the current price. We call these "floating levels." Statistics show that a significant majority of such floating levels are resolved in the future. However, in the case of a strong trend with multiple floating levels, it is advisable to wait for a trend reversal before taking a position. We discussed trend reversal and price direction in the lesson on combining DML levels with the MMD methodology.
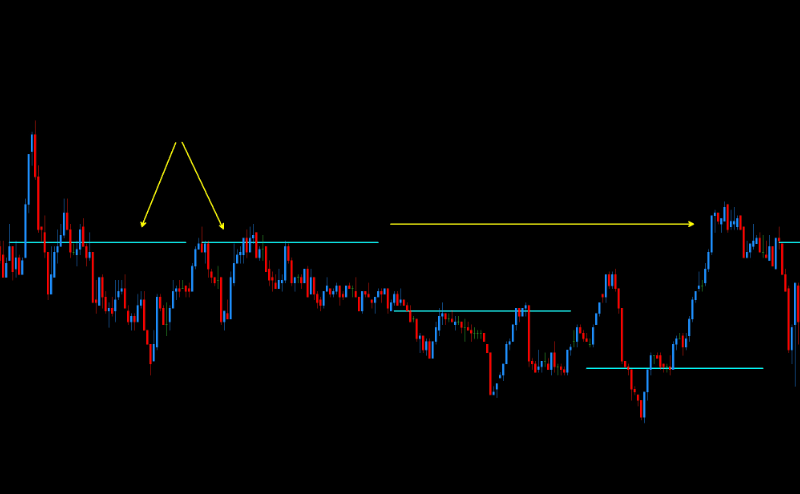
Approaching a "Double" Aqua
This is one of the most effective models for trading Aqua levels. It is applicable on currency pairs where Aqua levels are available. In this model, we look for opportunities to position ourselves at two consecutive Aqua levels that appear at exactly the same price point. Often, such a double level is resolved after the second level's duration ends. A dedicated Expert Advisor is available for trading this model, which you can find on the automated tools page or ask the support team about this EA.

Examples of Price Reaction to Aqua Levels
Want more knowledge?
Red & Magenta
Red levels are weekly supports and resistances. They appear on the chart on Wednesday afternoons and remain valid for the following week. Red levels consist of a total of six horizontal lines: three above the price and three below. The main Red levels, known as RedEx, are located at the extreme positions - both at the bottom and top. Approximately one-quarter of the distance between the lower and upper RedEx levels, the Red levels create a zone marked by two bold lines, both above and below the price.
Olive
Olive levels are generated once a day, around 19:00 GMT. This level consists of three zones. The middle zone is located around the price level at 19:00 GMT. The other two zones are located above and below the middle zone, at equal distances from it.
The range of these distances varies daily and indicates the potential movement dynamics for the next day. The lower zone is a very strong support for the next trading day, while the upper zone is a strong resistance for the next trading day.
