
DML & other strategies
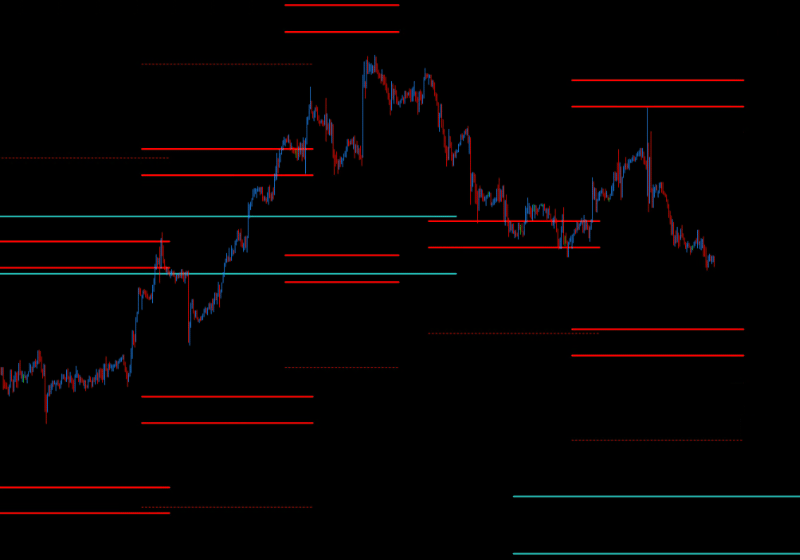
Combining DML levels — which are a unique projection of future price behaviors — with various technical analysis methods allows for a more comprehensive market view, increasing the confidence of investment decisions. Each combination has its advantages across different timeframes and market types, allowing the strategy to be tailored to the trader's individual needs and preferences.
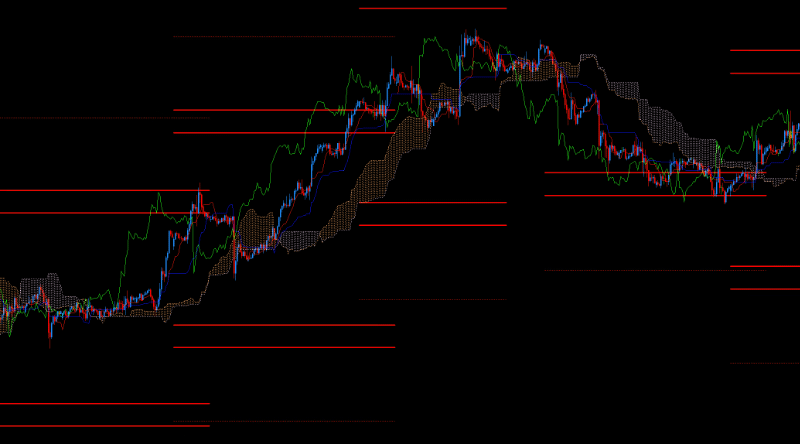
DML levels and Ichimoku Kinko Hyo
Method Description: Ichimoku Kinko Hyo is a technical indicator that provides a complete market view, including support and resistance lines, trend direction, and entry and exit points.
Integration with DML Levels: You can use DML levels as additional supports or resistances in conjunction with the Tenkan-sen, Kijun-sen, and Chikou Span lines in Ichimoku. If the price approaches a DML level while also being close to the Ichimoku indicator, it may be a signal to take a position.
Example of Use: When the price is below the Ichimoku cloud (a bearish signal) and approaches a DML level, consider selling after a bounce from that level. Conversely, if the price is above the cloud (a bullish signal) and approaches a DML level, it may be an opportunity to buy.
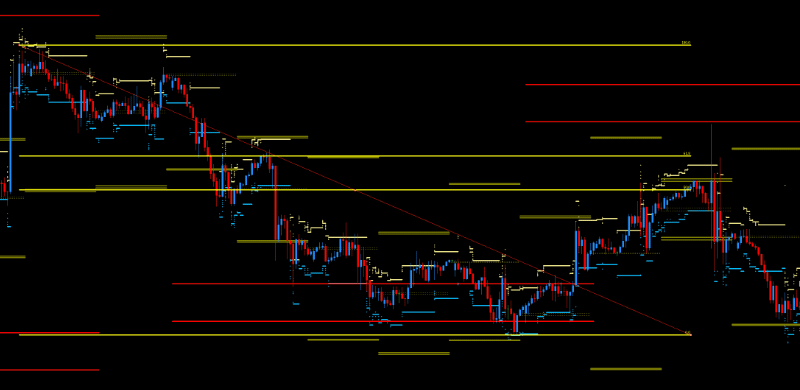
DML levels and Fibonacci Retracements
Method Description: Fibonacci retracements are used to identify potential support and resistance levels in the market. The most popular levels are 50% and 61.8%.
Integration with DML Levels: DML levels can be used to confirm Fibonacci retracements. If a DML level coincides with a Fibonacci level, it can strengthen its significance as a potential price reversal point.
Example of Use: In a market correction, if the price reaches the 61.8% Fibonacci level and coincides with a DML level, this can be a strong signal to enter a position in line with the main trend.
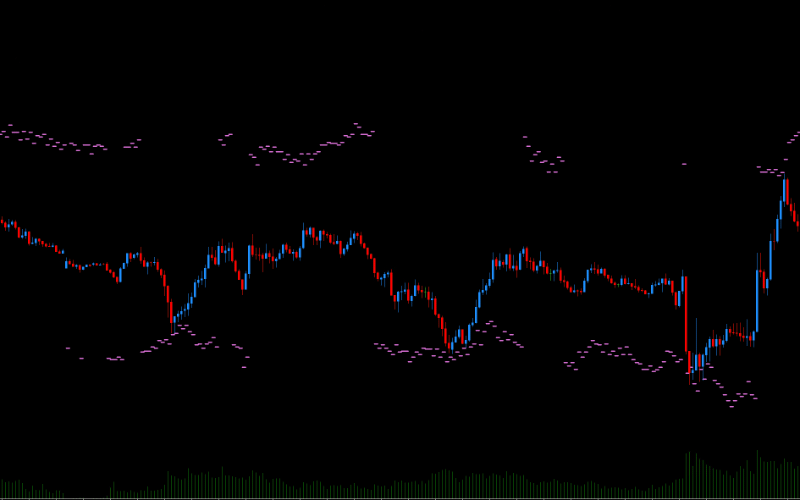
DML levels and Volumes
Method Description: Volume analysis involves monitoring the level of trading activity (volume) to help identify points where demand or supply may suddenly change.
Integration with DML Levels: DML levels can be used in conjunction with volume analysis to identify turning points. When the price reaches a DML level at high volume, it may suggest that the level is significant and a reversal could occur.
Example of Use: If the price approaches a DML level and there is a sharp increase in volume, this could signal that market participants are defending that level, potentially leading to a trend reversal. It is also worth noting DML levels that coincide with large amounts of pending orders, such as in futures contracts.
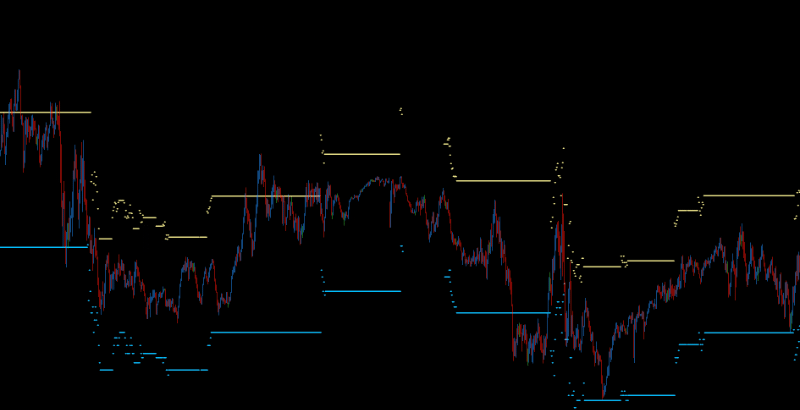
DML levels and Range Trading
Method Description: The range trading strategy involves identifying support and resistance levels between which the price moves.
Integration with DML Levels: DML levels can be used to identify the boundaries of the trading range. If DML levels are at similar levels to previous supports and resistances, they can be used as signals to open positions in the opposite direction.
Example of Use: If the price is in a range and approaches a DML level that coincides with the upper or lower boundary of that range, consider taking an opposite position (e.g., selling at the upper boundary or buying at the lower).
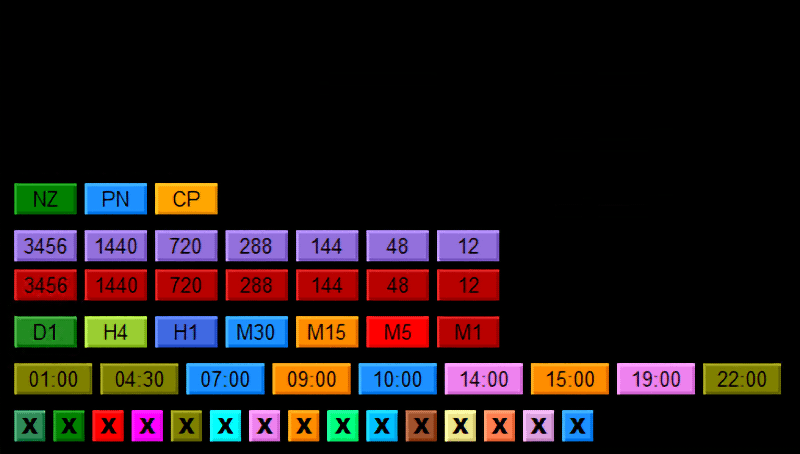
DML levels and Timeframes
Short-term (intraday): DML levels can be combined with indicators such as Ichimoku, moving averages, or volumes to obtain quick trading signals on smaller timeframes (e.g., M1, M5, M15).
Medium-term: DML levels can be combined with Fibonacci retracements and trend indicators on H1, H4 timeframes.
Long-term: Integrating DML levels with indicators such as moving averages or volume analysis on D1, W1, or monthly timeframes can help identify key levels for long-term investing.
Test a unique combination
See how the MMD methodology works with DML levels. Register for free at MagicOnCharts.com and download free indicators to support your trading, harnessing the potential of the MMD methodology backed by DML levels.