Lesson #6 - Sienna - Support
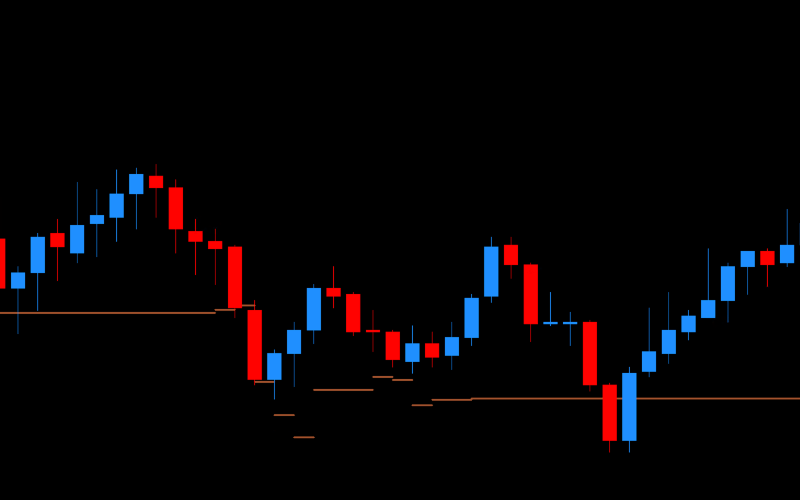
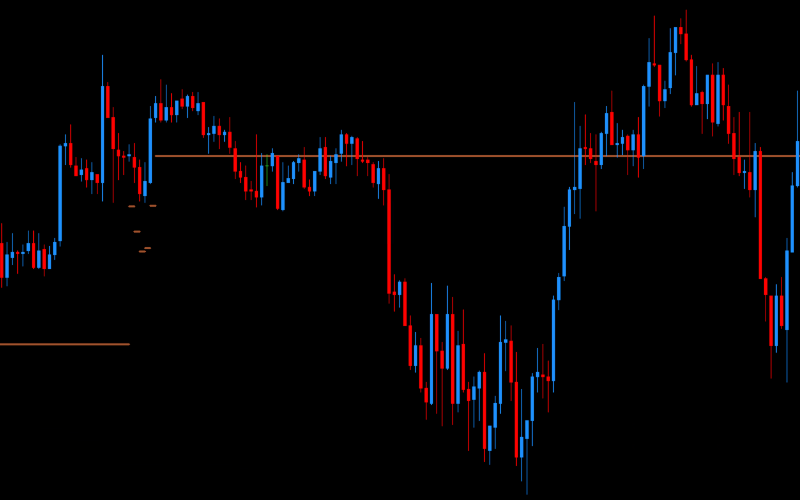
Sienna levels are a support level located close to the current price. This level is situated at a similar distance from the price as the Khaki level, which is a resistance. Sienna levels play a crucial role in maintaining the price above this level, providing solid support in short-term time frames. This level is published in 5-minute cycles. The level acts as support in areas where it appears as a "solid line," but historical data shows that its optimal effectiveness is until 11:00 AM GMT.

Characteristics of Sienna
Sienna levels, as part of the DML levels for the EURCAD currency pair, are characterized by a high frequency of interactions with the price, similar to Khaki levels. When the price approaches the Sienna level, it often finds solid support, preventing further declines. Such dynamics highlight the critical role of these levels in stabilizing the market and supporting the price in short-term perspectives. It is common for the price – for example, during the Asian session – to bounce between the Sienna and Khaki levels within a consolidation.
Strategies for Trading Sienna
There are two main models for utilizing Sienna levels in trading strategies:
Bounce from Support Level: This strategy involves observing the price as it approaches the Sienna level and opening a long position (BUY) upon a bounce. Traders expect the price to bounce off the Sienna level, creating an opportunity to enter a trade in the direction of the bounce.
Return to Breached Support: In situations where the price breaches the Sienna level, it is assumed that the price will return to this level. This strategy is useful in long-term analyses where the return to breached support can significantly improve risk and capital management.

Examples of Price Reaction to Sienna Levels on EURCAD

Introduce your idea
If you want to test Sienna levels for EURCAD, we have prepared a unique offer for you.
For only 2 GBP per month, you will have access to Sienna levels. If you purchase these levels in advance for 6 months, the price drops to 1 GBP per month of use. Is it worth it? Find out for yourself.
Not sure? Check how the Sienna level builds an advantage together with other levels from the "Flow Zone" group.
Advanced sets of DML levels for the EURCAD currency pair
Sienna
A package dedicated to beginners with no experience with DML levels.
10 GBP
50 days Sienna levels
Free Tools for Downloading and Visualizing DML Levels
EURCAD Edu
A complete package dedicated to those who have completed the educational process.
20 GBP
10 days Plum levels
10 days MediumOrchid levels
10 days Coral levels
10 days Khaki levels
10 days Sienna levels
10 days DeepSkyBlue levels
10 days DodgerBlue levels
10 days SpringGreen levels
10 days DarkOrange levels
20 days Violet levels
20 days Aqua levels
20 days Olive levels
40 days Red levels
40 days Magenta levels
80 days Green levels
80 days SeaGreen levels
Free Tools for Downloading and Visualizing DML Levels
EURCAD Tra
A complete package of DML levels dedicated to active traders.
60 GBP
50 days Plum levels
50 days MediumOrchid levels
50 days Coral levels
50 days Khaki levels
50 days Sienna levels
50 days DeepSkyBlue levels
50 days DodgerBlue levels
50 days SpringGreen levels
50 days DarkOrange levels
60 days Violet levels
60 days Aqua levels
60 days Olive levels
120 days Red levels
120 days Magenta levels
200 days Green levels
200 days SeaGreen levels
Free Tools for Downloading and Visualizing DML Levels
Note: The content of the data packages offered on DeepMarketLevel.com may be greater than what is published on this page. Check the current available offer and always stay one step ahead of other market participants.
Want more knowledge?
Khaki
Khaki levels are among the closest resistance levels relative to the current price, making them frequently reached and breached. These levels are characterized by a high repeatability of returns to the levels after being breached. They are particularly useful during the Asian session and the beginning of the European session. When left unresolved for a longer period, they become crucial points of reference for future market movements, initiating new swings, corrections, or waves upon resolution.
DeepSkyBlue2
DeepSkyBlue2 levels are a support level located further from the current price, similar to the MediumOrchid level – which is a resistance – but below the price.
These levels play a crucial role in maintaining the price above this level, providing solid support in medium- and long-term time frames. This level is published in 5-minute cycles. The level acts as support in areas where it appears as a "solid line," but historical data shows that its optimal effectiveness is until 11:00 AM GMT.
