
Lesson #11 - Olive
Olive levels are generated once a day, around 19:00 GMT. This level consists of three zones. The middle zone is located around the price level at 19:00 GMT. The other two zones are located above and below the middle zone, at equal distances from it. The range of these distances varies daily and indicates the potential movement dynamics for the next day. The lower zone is a very strong support for the next trading day, while the upper zone is a strong resistance for the next trading day.
Characteristics of Olive Levels
Olive levels, part of the DML levels for the EURCAD currency pair, have unique properties. If the price breaks through the lower or upper zone before the American session - which happens very rarely - we expect the price to return to this level. The middle zone of Olive is also very important. The price often returns to this level on the next trading day, making it a very precise reaction level.
Models for Trading Olive
Olive as Support
The lower zone of the Olive level acts as strong support for the next trading day. If the price approaches this zone, traders can expect this level to prevent further price declines, creating an opportunity to open long positions (BUY).
Olive as Resistance
The upper zone of the Olive level acts as strong resistance for the next trading day. If the price approaches this zone, traders can expect this level to prevent further price increases, creating an opportunity to open short positions (SELL).
Additional Tips
If the new level is not reached during the Asian session, it should be reached during the European or American session. If the middle zone is not reached during the Asian and European sessions, the likelihood of reaching this level during the American session increases significantly. This level, especially the middle zone, is a key reaction point that can be used for precise entries into positions.
Summary
Olive levels, as an integral part of models related to DML levels for the EURCAD currency pair, offer unique opportunities for identifying key support and resistance points and managing risk. Their application in trading practice can significantly enhance investment efficiency, providing precise tools for analyzing and predicting market movements.
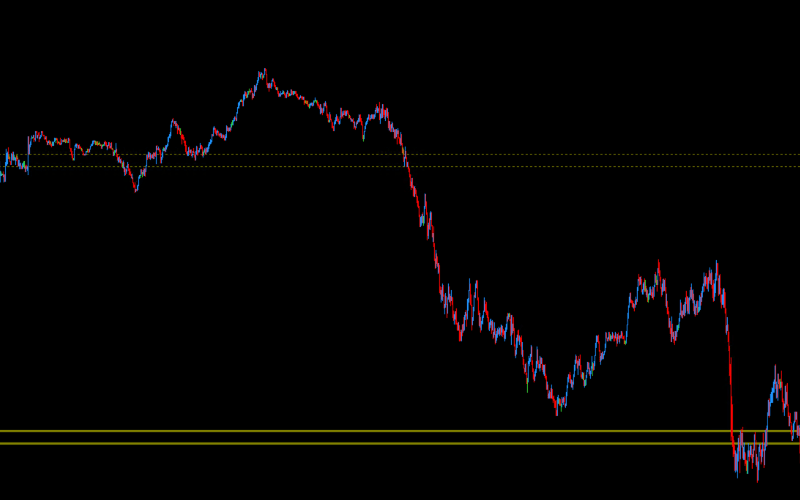
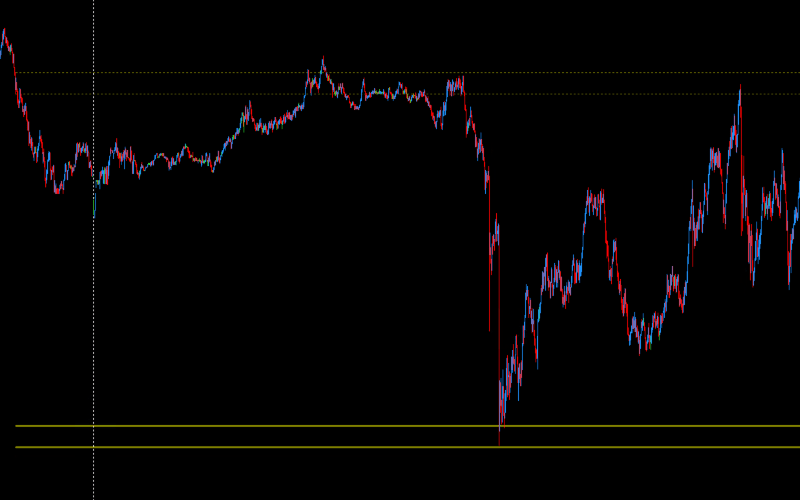
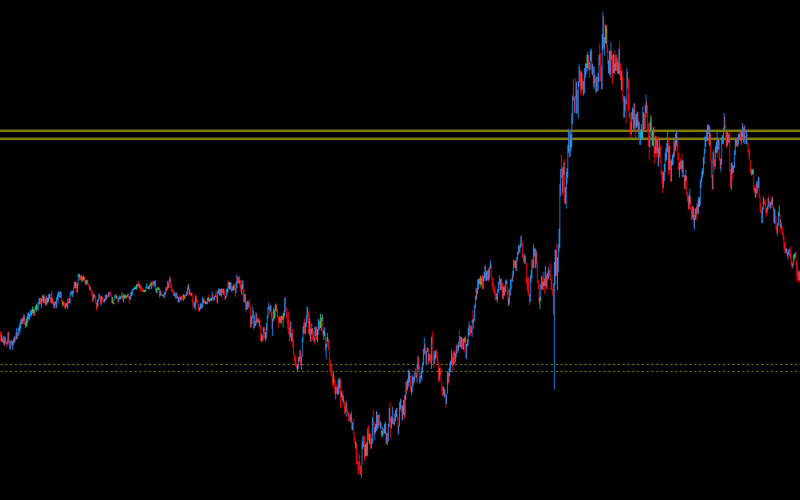
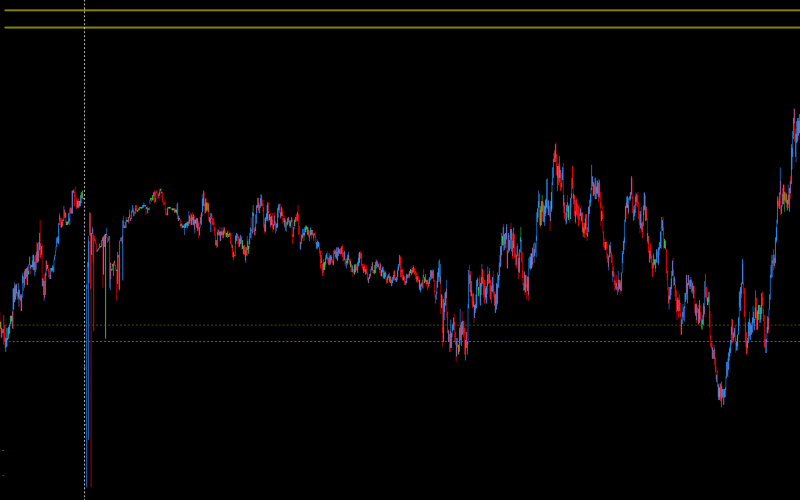
Examples of Price Reaction to Olive Levels on EURCAD Currency Pair

Introduce your idea
If you want to test Olive levels for EURCAD, we have prepared a unique offer for you.
For only 2 GBP per month, you will have access to Olive levels. If you purchase these levels in advance for 6 months, the price drops to 1 GBP per month of use. Is it worth it? Find out for yourself.
Not sure? Check how the Olive level builds an advantage together with other DML levels.
Advanced sets of DML levels for the EURCAD currency pair
Olive
A package dedicated to beginners with no experience with DML levels.
10 GBP
60 days Olive levels
Free Tools for Downloading and Visualizing DML Levels
EURCAD Edu
A complete package dedicated to those who have completed the educational process.
20 GBP
10 days Plum levels
10 days MediumOrchid levels
10 days Coral levels
10 days Khaki levels
10 days Sienna levels
10 days DeepSkyBlue levels
10 days DodgerBlue levels
10 days SpringGreen levels
10 days DarkOrange levels
20 days Violet levels
20 days Aqua levels
20 days Olive levels
40 days Red levels
40 days Magenta levels
80 days Green levels
80 days SeaGreen levels
Free Tools for Downloading and Visualizing DML Levels
EURCAD Tra
A complete package of DML levels dedicated to active traders.
60 GBP
50 days Plum levels
50 days MediumOrchid levels
50 days Coral levels
50 days Khaki levels
50 days Sienna levels
50 days DeepSkyBlue levels
50 days DodgerBlue levels
50 days SpringGreen levels
50 days DarkOrange levels
60 days Violet levels
60 days Aqua levels
60 days Olive levels
120 days Red levels
120 days Magenta levels
200 days Green levels
200 days SeaGreen levels
Free Tools for Downloading and Visualizing DML Levels
Note: The content of the data packages offered on DeepMarketLevel.com may be greater than what is published on this page. Check the current available offer and always stay one step ahead of other market participants.
Want more knowledge?
Violet
Violet levels are very similar to DarkOrange levels, with the difference being that Violet levels are determined on an hourly basis. The trading models are similar, but in this case, there is no designation of a FlowZone (FZ).
Red & Magenta
Red levels are weekly supports and resistances. They appear on the chart on Wednesday afternoons and remain valid for the following week. Red levels consist of a total of six horizontal lines: three above the price and three below.