
Lesson #12 - Red & Magenta
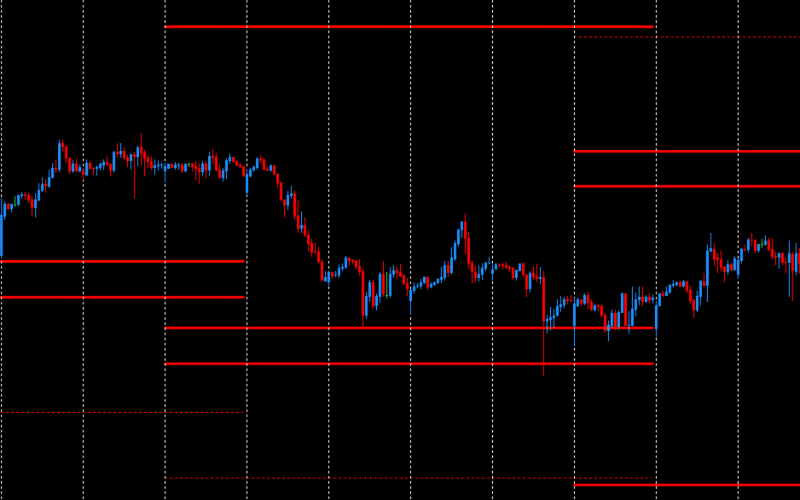
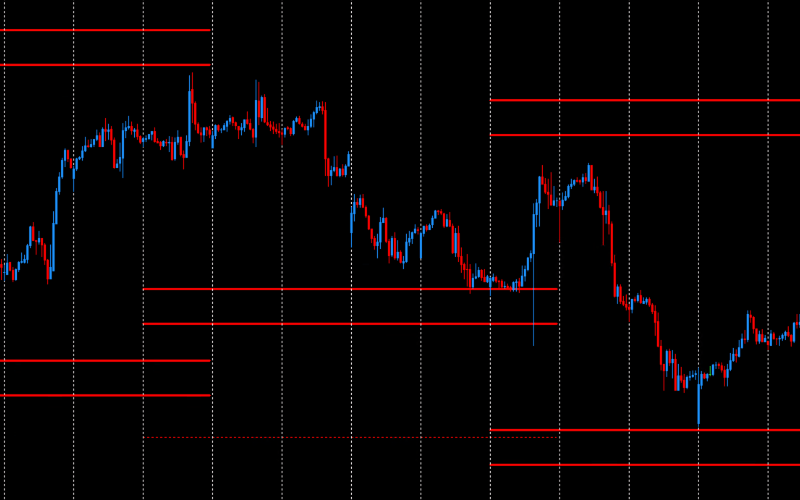
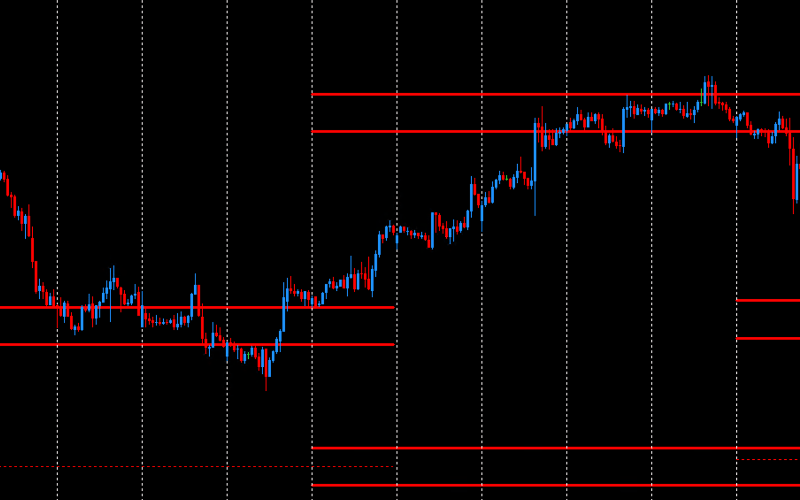
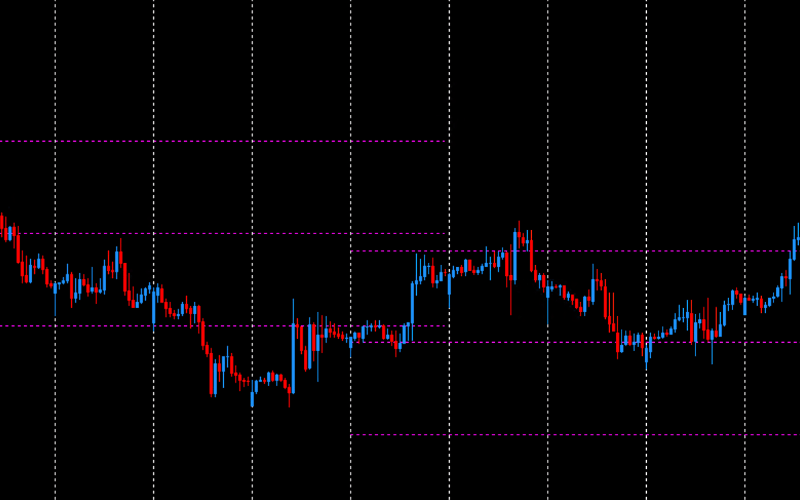
Red levels are weekly supports and resistances. They appear on the chart on Wednesday afternoons and remain valid for the following week. Red levels consist of a total of six horizontal lines: three above the price and three below. The main Red levels, known as RedEx, are located at the extreme positions - both at the bottom and top. Approximately one-quarter of the distance between the lower and upper RedEx levels, the Red levels create a zone marked by two bold lines, both above and below the price.
Characteristics of Red Levels
Red levels, part of the DML levels for the EURCAD currency pair, are determined once a week on Wednesday afternoons. Their validity lasts for the entire week until the next Wednesday when new levels are determined. These levels act as strong supports and resistances, significantly influencing price movements in the market.
Models for Trading Red
Red as Support
Red levels that act as support are crucial for maintaining the price above a certain level throughout the week. Traders can use these levels to open long positions (BUY) when the price approaches the Red support, expecting a rebound and price increase.
Red as Resistance
Red levels that act as resistance serve as important points where the price may struggle to rise further. Traders can use these levels to open short positions (SELL) when the price approaches the Red resistance, expecting a rebound and price decline.
Models for Trading Red
Transaction Models on Red Levels
On Red levels - those zones closer to the price - we typically play three transaction models:
Price reaction at the Red level and direction change: A strategy involving observing the price approaching the Red level and expecting a rebound.
Consolidation at the Red level: The price oscillates within the zone marked by two bold lines, creating an opportunity to play positions in a short range.
Breakthrough of the Red zone and return: After breaking through the Red zone, the price often reaches the RedEX level and then returns to the Red level.
Additional Tips
Red levels are updated weekly, meaning traders should regularly monitor new levels on Wednesday afternoons to adjust their trading strategies. The price does not often reach the Red levels, but when it does, it is an excellent setup to play, especially in combination with other DML levels, which you will learn more about in the upcoming lessons.
Summary
Red levels, as an integral part of models related to DML levels for the EURCAD currency pair, offer unique opportunities for identifying key support and resistance points and managing risk in long-term trading strategies. Their application can significantly enhance investment efficiency, providing precise tools for analyzing and predicting market movements over the course of a week.

Examples of Price Reaction to Red Levels on EURCAD
Magenta Levels
Description of Magenta Levels
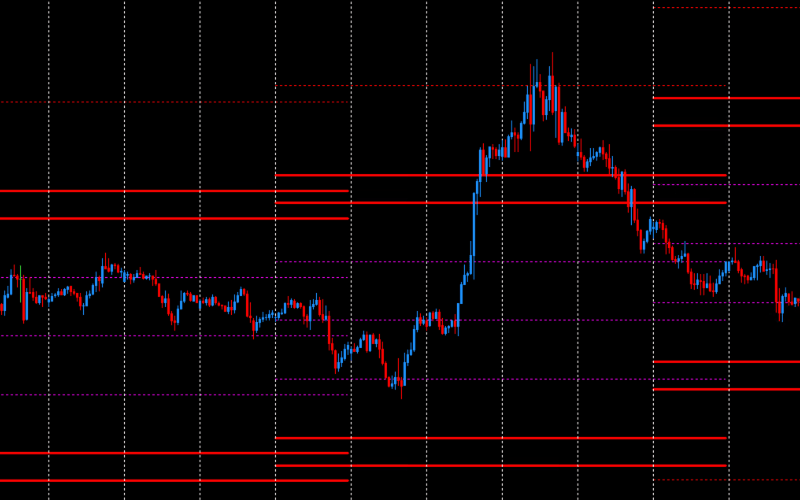
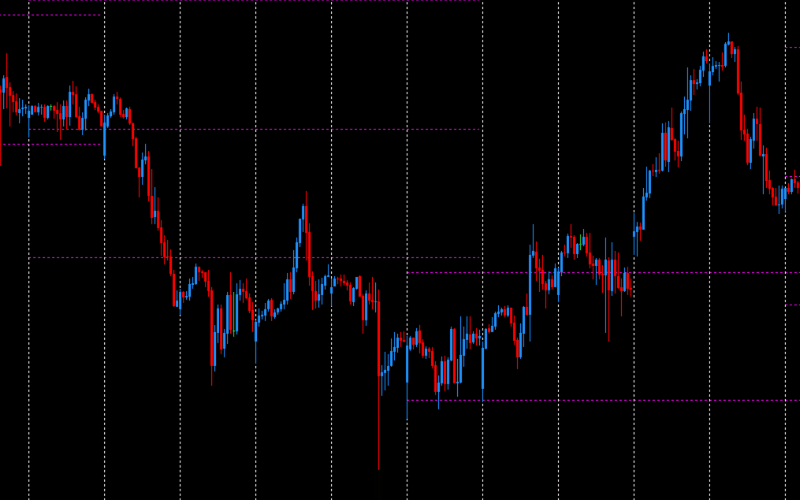
Magenta levels are three dashed lines that are determined in the same way as Red levels. Magenta levels divide the space between Red levels into four equal quarters. It is expected that the price will react to the Magenta levels, making them an important element in analysis and trading strategies.
Additional Tips
The Magenta level is very often reached by the price after the period separator appears at the close of the Wednesday trading day. This is a key moment that traders should consider in their strategies, as price reactions to the Magenta level can provide valuable insights into future price movements.
Summary
Magenta levels, as an integral part of models related to DML levels for the EURCAD currency pair, offer unique opportunities for identifying key turning points and managing risk. Their application in trading practice can significantly enhance investment efficiency, providing precise tools for analyzing and predicting market movements.
Examples of Price Reaction to Magenta Levels on EURCAD
Advanced sets of DML levels for the EURCAD currency pair
Red&Magenta
A package dedicated to beginners with no experience with DML levels.
10 GBP
120 days Red levels
120 days Magenta levels
Free Tools for Downloading and Visualizing DML Levels
EURCAD Edu
A complete package dedicated to those who have completed the educational process.
20 GBP
10 days Plum levels
10 days MediumOrchid levels
10 days Coral levels
10 days Khaki levels
10 days Sienna levels
10 days DeepSkyBlue levels
10 days DodgerBlue levels
10 days SpringGreen levels
10 days DarkOrange levels
20 days Violet levels
20 days Aqua levels
20 days Olive levels
40 days Red levels
40 days Magenta levels
80 days Green levels
80 days SeaGreen levels
Free Tools for Downloading and Visualizing DML Levels
EURCAD Tra
A complete package of DML levels dedicated to active traders.
60 GBP
50 days Plum levels
50 days MediumOrchid levels
50 days Coral levels
50 days Khaki levels
50 days Sienna levels
50 days DeepSkyBlue levels
50 days DodgerBlue levels
50 days SpringGreen levels
50 days DarkOrange levels
60 days Violet levels
60 days Aqua levels
60 days Olive levels
120 days Red levels
120 days Magenta levels
200 days Green levels
200 days SeaGreen levels
Free Tools for Downloading and Visualizing DML Levels
Note: The content of the data packages offered on DeepMarketLevel.com may be greater than what is published on this page. Check the current available offer and always stay one step ahead of other market participants.
Want more knowledge?
Olive
Olive levels are generated once a day, around 19:00 GMT. This level consists of three zones. The middle zone is located around the price level at 19:00 GMT. The other two zones are located above and below the middle zone, at equal distances from it. The range of these distances varies daily and indicates the potential movement dynamics for the next day.
SeaGreen & Green
SeaGreen levels are monthly supports and resistances set at the beginning of each calendar month. The price rarely reaches these levels, but when it does, it usually either changes direction long-term or consolidates at that level.
This makes it an ideal level for investors and traders who position their trades over a longer time frame.